

If you ever experience problems with your network connection and need a deeper analysis of what exactly is happening on your network, you should definitely use Wireshark. Wireshark is the de-facto application worldwide that anyone can use for the above purposes.
It is an open source solution, originally known as Ethereal, that aims to capture and visualize packets in real time and in a format easily readable by its users. It includes filters, different color representations, and other features that will help you delve deeper into your network environment and analyze individual packets.

Somewhere here we should also mention the existence of the tshark tool, i.e. the terminal-only version of Wireshark. It is also used for packet capture and analysis and is quite useful for cases where the graphical interface (GUI) is not available. More information about tshark can be found on the official Wireshark page.
In this article we will look at some key features of this highly effective tool, where you can download it and how to use it.
How does WIRESHARK work?
As we have already said, Wireshark is a packet sniffer and analyzer. It captures network traffic on a local network and then stores the data for later analysis. It can analyze packets from Ethernet, Bluetooth, 802.11 (Wireless), Token Ring, and Frame Relay connections.
Wireshark allows the use of filters before, during, or after packet capture to help users find what they are really looking for. For example, you can set a filter that will allow you to see only the TCP connection between 2 specific IP addresses. This particular feature, namely filters, has made Wireshark perhaps the most useful packet analysis tool.
How to install it
Wireshark is supported by Windows, Mac , and Linux operating systems. Installation is very easy and its basic version is offered for free.
Windows
Installing WIRESHARK in a Windows environment is very simple. First, you need to know your system type (32-bit or 64-bit). Then visit the official Wireshark page and select the appropriate installer, depending on the type of your machine. Download it locally on your computer and run it by choosing the desired installation folder. The installed one already includes Npcap, the tool that will be responsible for capturing packets.
Mac
Wireshark is available through the package manager, Homebrew. To install Homebrew, run the following command in a terminal:
| /usr/bin/ruby -e “$(curl -fsSL https://raw.githubusercontent.com/Homebrew/install/master/install)” |
With Homebrew installed, you can access several open source programs for Mac. Install Wireshark by running the following command in a terminal:
| brew install wireshark |
Hombrew will also install all the relevant dependencies on your computer so that Wireshark works properly.
Linux
Depending on your Linux distribution, installing Wireshark on your computer may differ. Run the following commands in a terminal:
Ubuntu
| sudo apt-get install wireshark sudo dpkg-reconfigure wireshark-common sudo adduser $USER wireshark |
The above commands will download Wireshark, update it, and then grant user permissions so you can use it.
Red Hat/Fedora
| sudo dnf install wireshark-qt sudo usermod -a -G wireshark username |
The above commands install the GUI and CLI (command/line version) versions of Wireshark while also granting the necessary permissions for its use.
Kali Linux
As you might expect, Wireshark is pre-installed in this Linux distribution. You can find it in the “Sniffing & Spoofing”
How to use it
Now that we have Wireshark installed on our computer, let's see how we can first capture packets and then analyze network traffic.
Packet capture
When you open Wireshark, you will see a screen that lists all the network connections that you can monitor. You can also use the capture filter field to capture only the network traffic that you are interested in.
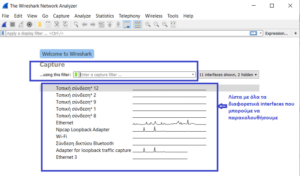
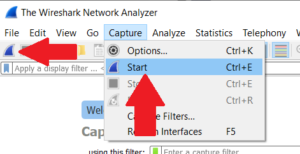
By selecting the desired interface (e.g. Ethernet), the analysis can be started in one of the following ways:
- By clicking on the blue flap on the toolbar named “Start Capturing Packets”
- By selecting Capture in the menu and then Start
- Pressing the Control and E keys.
- Double-clicking on the interface we are interested in
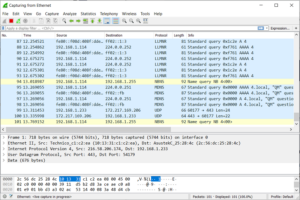
Now we can see in real time all the packets that Wireshark has captured for us.
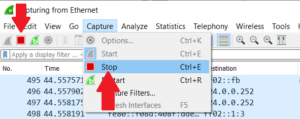
To end packet capture, we can click the red flap on the toolbar or navigate to the menu and specifically to the Capture option and then Stop.
Packet Analysis
Wireshark consists of three main analysis windows. If we select a specific packet, we see that the 2 lower windows are configured to show us more information about that packet. Let's look at the details for each column in the upper window:
- No.: The order in which the packets were captured. The square bracket indicates that the packet is part of a “conversation”.
- Time: Time elapsed from the start of the capture until the capture of the specific packet
- Source: the IP address of the system that sent the packet.
- Destination: the IP address of the system that received the packet.
- Protocol: The type of each packet, e.g. TCP, DNS, DHCPv6, ARP, etc.
- Length: The size of the packet in bytes.
- Info: More information about the contents of each package.
The middle window called “Packet Details” shows us information related to the packet in as readable a format as possible. The bottom window, called “Packet Bytes” shows us the packet itself in hexadecimal format. In this window, if we are examining a packet that is part of a “conversation”, we can right-click on it, select Follow, and see only the packets of that particular “conversation”.
WIRESHARK filters
Two of the best features of Wireshark are the Wireshark Capture and Wireshark Display filters. The filters allow us to examine the packets we have captured the way we want and need to see them in order to better fix the network problem we may be facing.
Wireshark Capture Filters
This function is used to filter the packets we capture. In practice, if the packets do not meet the conditions that we define, Wireshark does not even save them. Some examples of filters that we can use are:
- HostIP-address: Filtering based on IP address.
- net168.0.0/24: Filter all internet traffic on the subnet.
- dsthostIP-address: Filtering packets sent to the specified host.
- Port 22: Filtering based on traffic on port 22.
- Portnot 22 andnot 22: Traffic-based filtering and not shh and arp.
Wireshark Display Filters
The Wireshark Display Filter changes the image of the traffic that we have captured during analysis. After we have stopped capturing packets, we can use this feature to facilitate our analysis to fix the problem. Such filters can be the following:
- ip.src==IP-addressandip.dst==IP-address: This filter will show us the packets that start from one computer and end at the other.
- tcp.porteq 80: It will show us all traffic on port 80.
- Icmp: This filter will only show us icmp traffic.
- ip.addr != IP_address: It will show us all traffic except that originating from or destined for the specific computer.
More WIRESHARK tools
In addition to packet capture and filtering, there are many other tools in Wireshark that can make things a lot easier.
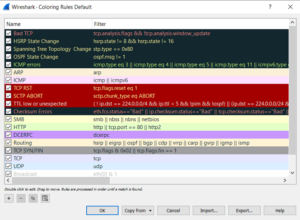
We can configure Wireshark so that the packets we capture are colored according to the filters we have set. More examples of this can be seen here.
By default, Wireshark only captures packets originating from or sent to the local computer. By going to the Capture menu option and then to Options, we can see the tick-box “enable promiscuous mode for all interfaces”. This option allows us to capture packets traveling across the entire network we are connected to.
Wireshark also provides a Command Line Interface (CLI) so that we can use it on a system that does not support a graphical interface.
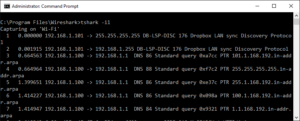
In such an environment we could run the following commands:
- Wireshark: to start wireshark in a GUI environment
- Wireshark -h: to see all the available parameters that Wireshark can receive.
- wireshark –aduration:300 –ieth1 –wwireshark.: to capture Ethernet traffic for 5 minutes.
Also, for the purpose of our practice, we can download ready-made files that Wireshark itself offers and contain packets from different network traffic. We can then load these files into the tool by selecting File, then Open and selecting the desired file for analysis.
As we said, WIRESHARK is a very powerful tool and what we did in this article is to see a few of the features it offers. Professionals in the field use it to analyze network protocol applications, examine security issues, and to have better visibility into their network traffic. More information about WIRESHARK can be found in its official user guide.
We look forward to your comments and impressions.
